I build Power BI dashboards, Python models, and data stories that help businesses move from raw numbers to clear decisions. Focused on business intelligence, machine learning, and analytics that are useful from day one.
Turning data into
decisions that matter.
I'm Dhyey Jani, a data analyst based in Ontario, Canada, building a portfolio centred on business intelligence, dashboarding, machine learning, automation, and data storytelling. My focus is on work that is analytically sound and immediately useful to business stakeholders.
My Power BI dashboards are designed around clarity and interactivity, giving decision-makers filterable views of performance without needing to open a spreadsheet. My Python and notebook projects follow the same standard: structured, reproducible analysis with findings that can be acted on.
I'm actively building toward a full-time data analyst or BI analyst role where I can contribute meaningful analytical work from day one.
Explore my portfolio of data analytics work across business intelligence, SQL analysis, and machine learning. Each project demonstrates practical problem-solving using highly realistic data that mirrors complex business environments.
Below is a collection of interactive dashboards I've built using Power BI. Each project highlights a unique data story, whether it's tracking trends, uncovering insights, or visualizing performance.
These dashboards were created by connecting, transforming, and modeling data from various sources, then designing visuals that make complex information easy to explore.
Feel free to click through, apply filters, and interact with the data to dive deeper into each project.
Track sales performance across regions, products, and time periods with interactive filters and trend analysis.
Monitor financial metrics, revenue trends, and budget analysis to support business planning and period reviews.
Monitor supply chain operations, inventory levels, and supplier performance across multiple operational views.
Track overall sales performance and revenue trends to support business reviews and strategic planning decisions.
Supply chain data is often spread across separate views of revenue, inventory, product activity, and supplier performance, making it difficult to review overall operational health in one place. This report was designed to bring those areas together in a clearer dashboard structure that supports both summary-level review and more focused analysis.
How are revenue, stock levels, product movement, and supplier performance trending across the supply chain?
Built as a Power BI practice project inspired by a public supply chain dashboard pattern, with my own analysis refinements and presentation decisions.
The report was built in Power BI as a multi-page dashboard with Overview, Product, and Supplier sections. KPI cards highlight core business measures including Total Revenue ($578K), Total Product Sold (46,099), Total Costs (58K), Stock Level (4,777), and Avg Profit Margin % (86.07).
Additional visuals break performance down by product type, SKU, shipping carriers, transportation modes, and supplier-level analysis. SKU and Supplier name slicers allow users to narrow the dashboard to specific operational segments without manually filtering source data.
The overview page gives a quick snapshot of commercial and operational performance through KPI cards and category-level revenue views.
The product page brings together order quantity, stock level, lead time, and profit margin visuals to support product-level monitoring.
The supplier page focuses on supplier analysis, transportation costs, stock contribution, and SKU-level product relationships for vendor review.
This dashboard turns multiple supply chain views into a more connected analytical report that is easier to navigate and interpret. Instead of reviewing separate tables or exports, users can move between overview, product, and supplier perspectives while keeping the same filtering context.
A comprehensive SQL analysis project using a sales database with four relational tables: sales transactions, products, geographical regions, and salesperson data. The queries below demonstrate data retrieval, filtering, calculated columns, aggregation, and conditional logic used to extract business insights from the database.
Explore sales performance across products, regions, and salespeople through interactive visualizations built from the SQL database.
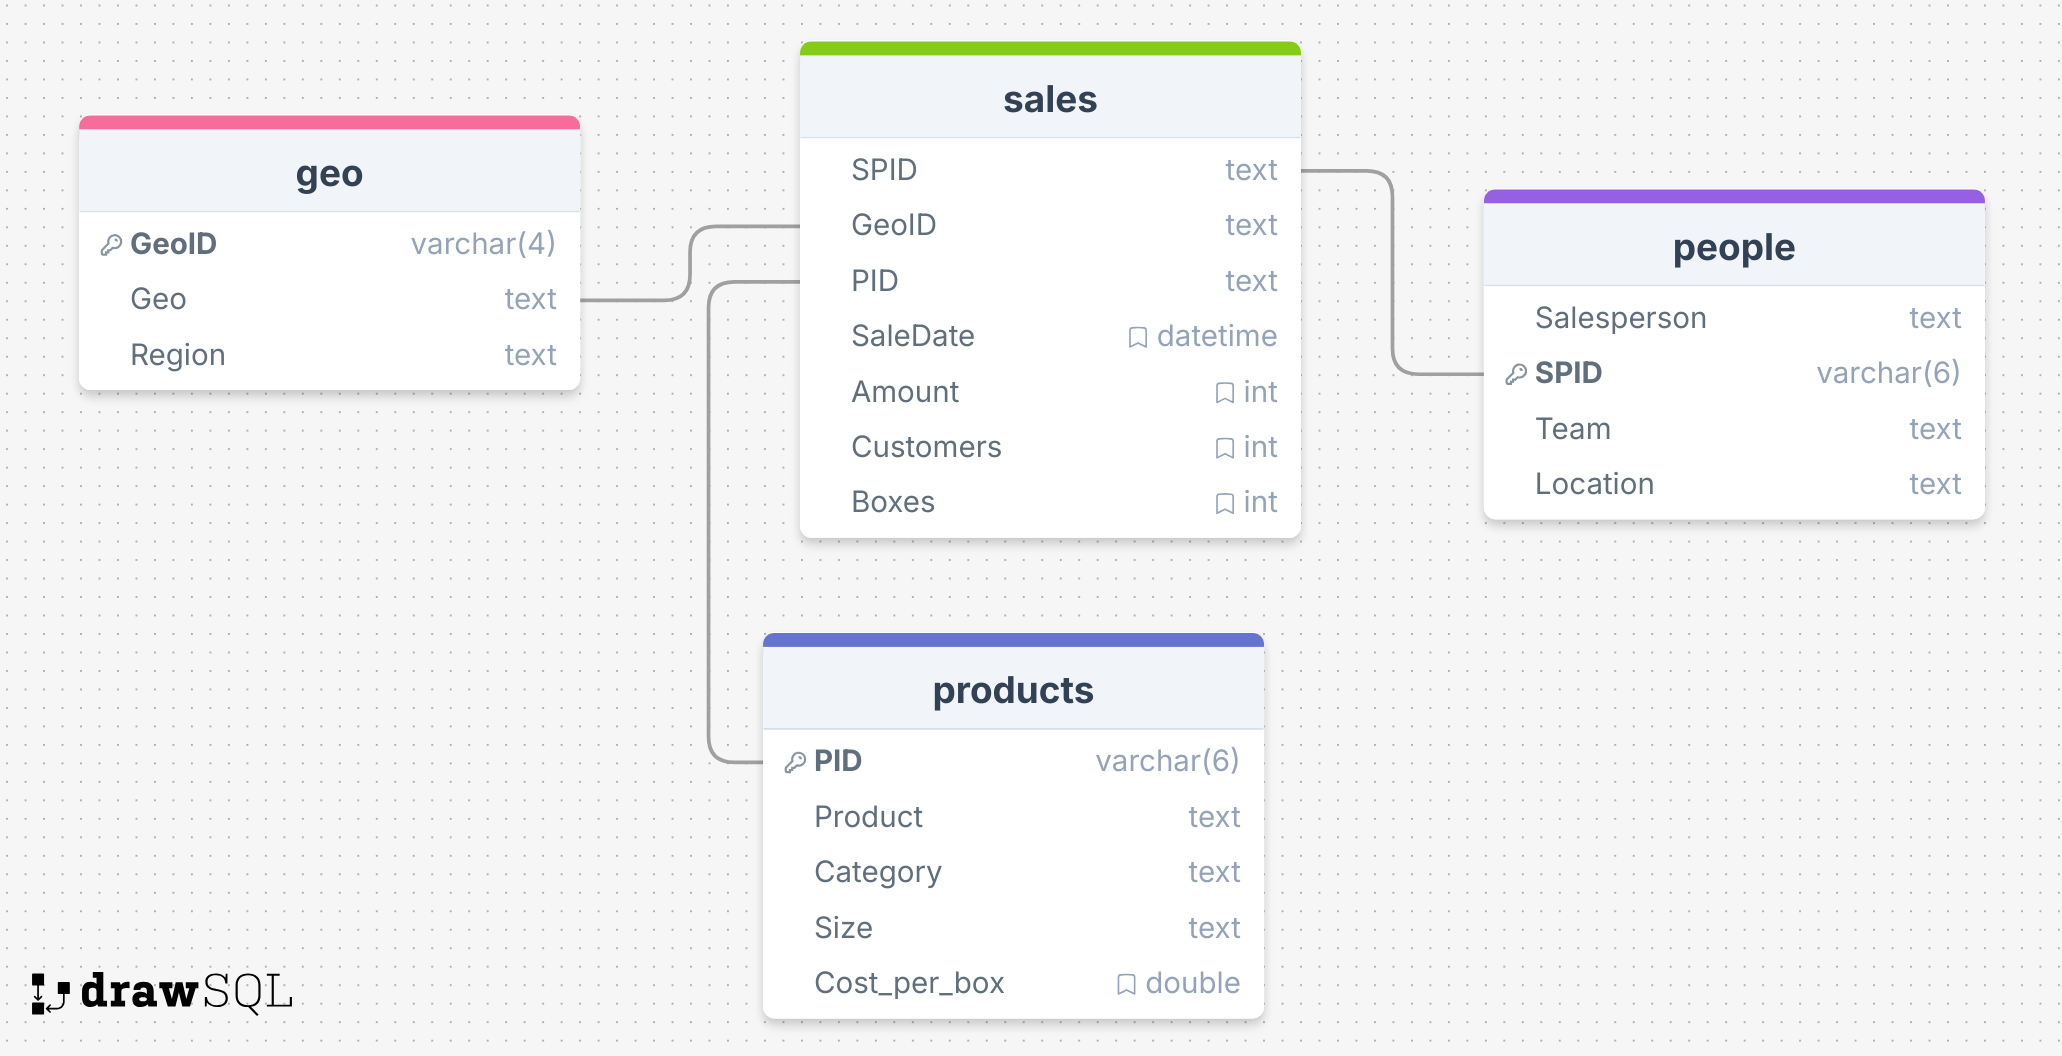
Database structure showing four relational tables with primary and foreign key constraints. Sales data connects to geography, products, and salesperson tables.
A collection of SQL queries demonstrating data retrieval, filtering, calculated columns, aggregation, and conditional logic.
SELECT * FROM sales;
SELECT SaleDate, Amount, Customers FROM sales;SELECT Amount, Customers, GeoID FROM sales;
SELECT SaleDate, Amount, Boxes, Amount / boxes FROM sales;
SELECT SaleDate, Amount, Boxes, Amount / boxes AS 'Amount per box' FROM sales;
SELECT * FROM salesWHERE amount > 10000;
SELECT * FROM salesWHERE amount > 10000ORDER BY amount DESC;
SELECT * FROM salesWHERE geoid='g1'ORDER BY PID, Amount DESC;
SELECT * FROM salesWHERE amount > 10000 AND SaleDate >= '2022-01-01';
SELECT SaleDate, Amount FROM salesWHERE amount > 10000 AND year(SaleDate) = 2022ORDER BY amount DESC;
SELECT * FROM salesWHERE boxes > 0 AND boxes <= 50;
SELECT * FROM salesWHERE boxes BETWEEN 0 AND 50;
SELECT SaleDate, Amount, Boxes, weekday(SaleDate) AS 'Day of week'FROM salesWHERE weekday(SaleDate) = 4;
SELECT * FROM people;
SELECT * FROM peopleWHERE team = 'Delish' OR team = 'Jucies';
SELECT * FROM peopleWHERE team IN ('Delish','Jucies');
SELECT * FROM peopleWHERE salesperson LIKE 'B%';SELECT * FROM peopleWHERE salesperson LIKE '%B%';
SELECT SaleDate, Amount, CASE WHEN amount < 1000 THEN 'Under 1k' WHEN amount < 5000 THEN 'Under 5k' WHEN amount < 10000 THEN 'Under 10k' ELSE '10k or more' END AS 'Amount category'FROM sales;
SELECT team, count(*) FROM peopleGROUP BY team;
These projects cover machine learning, process automation, customer analytics, and social media analysis. All built in Python and published on GitHub. Each represents a structured analytical workflow from problem framing through to interpretation, readable directly in a browser.
Python-based analytical work lives in GitHub repositories and Jupyter notebooks, readable as both runnable code and narrative reports. Each project below links directly to the file or report, viewable without any setup by recruiters or hiring managers.
A structured predictive modelling project applying machine learning techniques to a real dataset. Covers model selection, training, evaluation, and documented interpretation of results in a final analytical report.
A machine learning project using the MNIST handwritten digit dataset to build, train, and evaluate classification models. Exploring model architectures and benchmarking performance on a well-known image recognition problem.
A process automation project built for a credit union context. Python scripting and a notebook-based workflow replace a repetitive manual data handling task, reducing effort and improving consistency.
A customer analytics project using clustering techniques to identify meaningful customer segments from transactional or behavioural data. Supporting targeted marketing and retention decisions.
A Jupyter notebook exploring patterns, trends, and engagement metrics across social or content-related data. Surfacing platform-level and time-based insights into what drives content performance.
I'm actively building my analytics portfolio and exploring roles that align with my skills. Whether you're hiring, want to collaborate on a project, share experiences, or offer suggestions and feedback. I'd be glad to hear from you through any of the channels below.
If you have any questions, feedback, or just want to connect, feel free to reach out. I'm always open to learning, collaborating, and new opportunities.
Whether you're working on something in data, looking for someone to join your team, or simply want to share thoughts. I'd be happy to hear from you. Every connection is a chance to grow and improve, and I'm excited to keep learning as I go.